CardioNIR — Trans-Myocardial Metabolomics
Untargeted Metabolomic Profiling of Acylcarnitines and Amino Acids During Cardiac Surgery
1 Overview
Work Package 5 (WP5) of the CardioNIR project performed untargeted metabolomic profiling of dried blood spot (DBS) samples collected during cardiac surgery with cardiopulmonary bypass (CPB) in a preclinical swine model. Using UHPLC-UHR-QqTOF mass spectrometry (Bruker Impact II), we characterised the temporal dynamics of 46 blood metabolites — primarily acylcarnitines and amino acids — across surgical phases.
Arterial blood samples were collected at serial timepoints during CPB and spotted onto Whatman 903 Protein Saver DBS cards. Metabolite co-expression networks were constructed using Spearman correlations (|ρ| ≥ 0.60) for each surgical phase: Early ECC (Basal + T0–10 min, n=25), Mid ECC (15–20 min, n=16), Late ECC (25–40 min, n=32), and Reperfusion (T0 + 5 min, n=16).
2 DBS Extraction Optimisation
Extraction conditions for metabolites from DBS were systematically optimised using a response surface design. Three DBS blood samples from different donors with three technical replicates across 12 different extraction protocols were tested. The optimal conditions identified were: 1/4 spot in 100 µL methanol:water (80:20), with 30 minutes extraction at room temperature. This protocol maximised metabolite yield while maintaining reproducibility across biological replicates.
3 UHPLC-QqTOF Analysis
Preliminary untargeted metabolomics experiments were performed on 56 samples from WP2 using the Bruker Impact II ultra-high-resolution quadrupole time-of-flight mass spectrometer. Both positive and negative ionisation modes were employed. Principal Component Analysis of all detected features revealed clear clustering patterns among samples, with separation along the first two principal components corresponding to experimental phase and ischemia duration.
4 Phase-Specific Metabolite Networks
The central finding of the metabolomics analysis is the dramatic reorganisation of metabolite co-expression networks across surgical phases. Each network panel below shows 46 metabolites as nodes, with edges representing Spearman correlations (|ρ| ≥ 0.60). Node colour encodes metabolite class: amino acids (blue), short-chain acylcarnitines (orange), medium-chain acylcarnitines (green), and long-chain acylcarnitines (red).
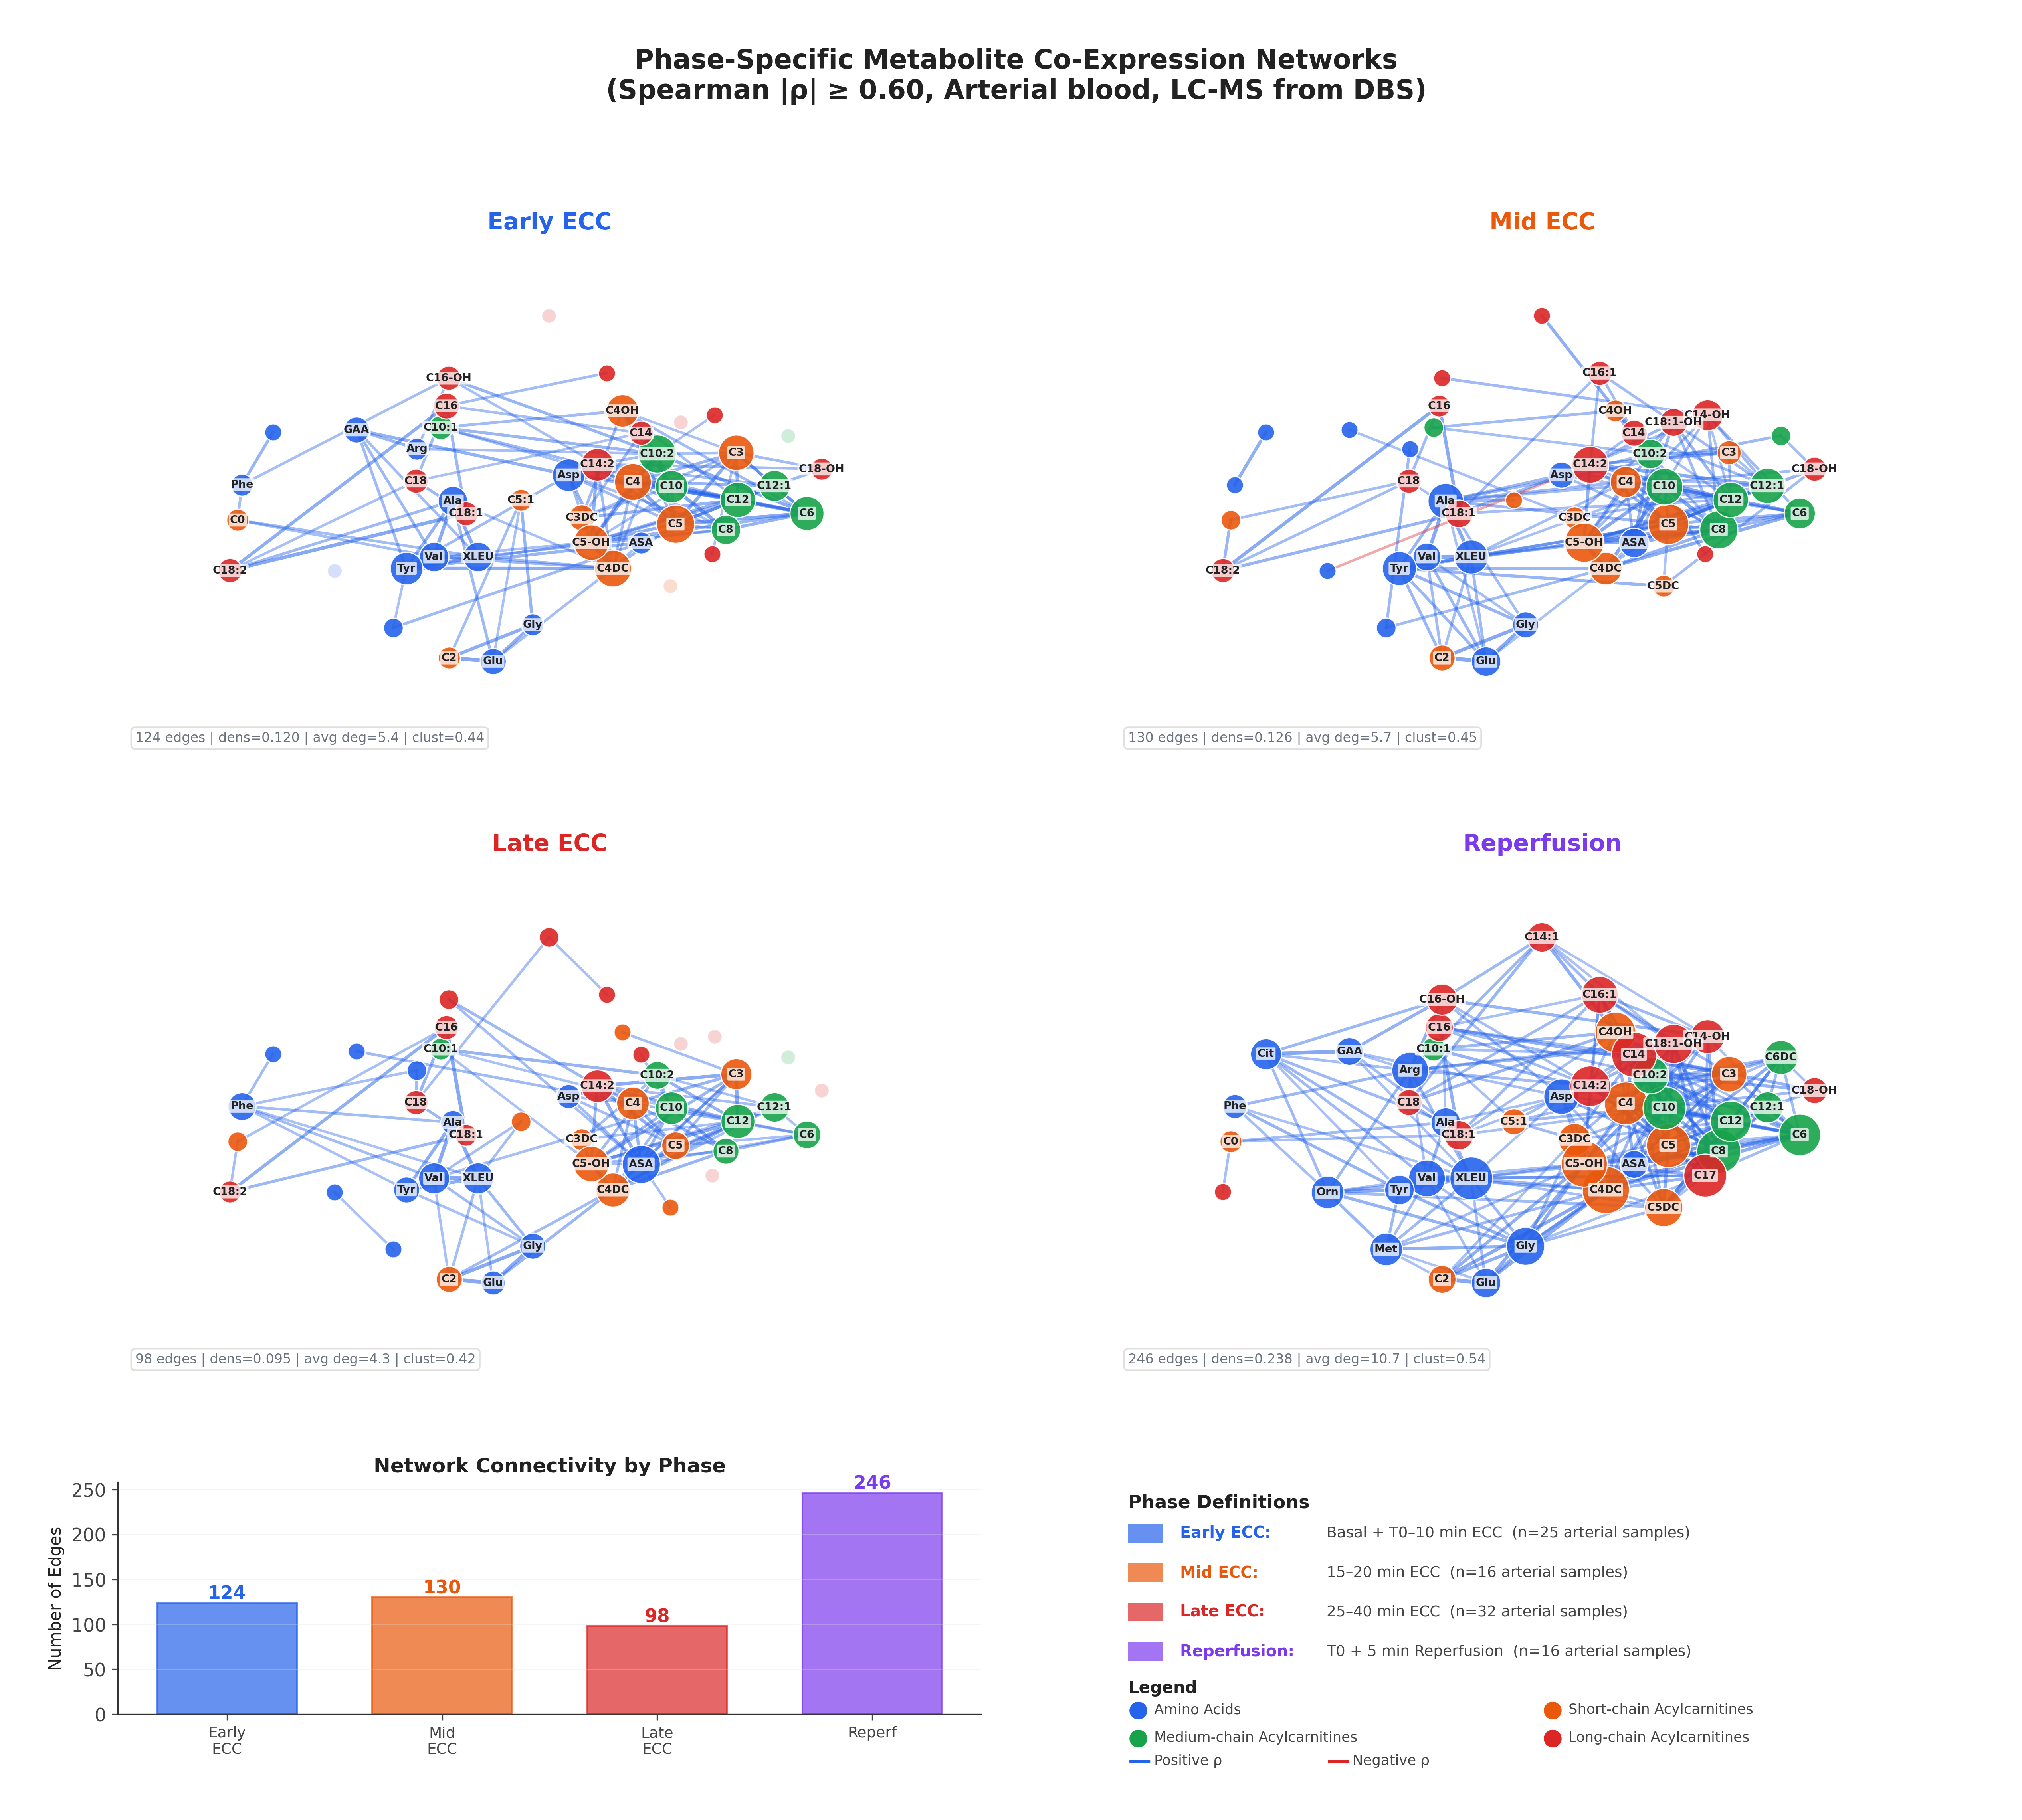
4.1 Network Connectivity Dynamics
| Phase | Edges | Density | Avg Degree | Clustering |
|---|---|---|---|---|
| Early ECC | 124 | 0.120 | 5.4 | 0.44 |
| Mid ECC | 130 | 0.126 | 5.7 | 0.45 |
| Late ECC | 98 | 0.095 | 4.3 | 0.42 |
| Reperfusion | 246 | 0.238 | 10.7 | 0.54 |
The metabolite networks reveal a striking three-act pattern:
- Stable early coordination (Early → Mid ECC): The network maintains its structure with ~124–130 edges, reflecting intact metabolic homeostasis during the initial bypass period
- Progressive breakdown (Mid → Late ECC): A 21% loss of connections (130 → 98 edges) by late ECC signals the metabolic exhaustion threshold at approximately 35–40 minutes of bypass
- Reorganisation, not recovery (Late ECC → Reperfusion): When blood flow returns, the network does not restore its original topology — instead, it reorganises into a denser configuration with 2.5× more connections (246 edges) than late ECC, reflecting a fundamentally different metabolic state
5 During Bypass: Coordination Breaks Down
Between early and late ECC, 75 connections were lost while 49 new ones formed and 49 were preserved. The metabolites most affected by this disruption were:
- Short-chain fat carriers (isovalerylcarnitine, hexanoylcarnitine) lost the most connections — these small fuel molecules are the first to decouple as mitochondrial β-oxidation is disrupted
- Argininosuccinic acid, a urea cycle intermediate and waste-processing molecule, suddenly gained 10 new connections it did not have before — the cellular stress response was building its own network
6 Key Molecules: The Most Connected Hubs
Fat-transport carnitines — methylmalonylcarnitine, isovalerylcarnitine, and hydroxyisovalerylcarnitine — remained central throughout all phases. These molecules sit at the crossroads of the heart’s fuel system, linking fatty acid oxidation to energy production.
Phase-specific hub shifts reveal the biological narrative:
- Late bypass: Argininosuccinic acid becomes the top hub — a sign of accumulating cellular stress and impaired waste processing
- Reperfusion: Myristoylcarnitine (C14, a long-chain fat carrier) becomes the most connected molecule — the heart is restarting fat oxidation as its primary energy source
7 At Reperfusion: Three Metabolic Groups Emerge
When blood flow returns, the 46 metabolites self-organise into three distinct clusters:
Group 1 (20 metabolites): Short- and medium-chain acylcarnitines — the fat oxidation restart module
Group 2 (18 metabolites): Amino acids + free carnitine + acetylcarnitine — the energy cycle recovery module
Group 3 (8 metabolites): Long-chain acylcarnitines (myristoyl- to stearoylcarnitine) — the fuel supply module
This three-module structure was absent during bypass, where metabolites were more diffusely connected. Its emergence at reperfusion suggests a coordinated restart of mitochondrial energy metabolism, with each module handling a distinct aspect of metabolic recovery.
8 Convergent Dynamics: Proteins and Metabolites
A key insight from the CardioNIR multi-omics approach is that the proteomic data (49 cardiovascular proteins, Olink CVD III) shows strikingly similar network dynamics:
| Feature | Protein Networks | Metabolite Networks |
|---|---|---|
| Bypass disruption | 70% connectivity loss | 21% connectivity loss |
| Collapse timing | 35–40 min | 35–40 min |
| Key disrupted nodes | VE-cadherin, ICAM-2 (vascular barrier) | Isovalerylcarnitine, hexanoylcarnitine (fuel carriers) |
| Reperfusion hub | Spondin-1 (ECM remodelling) | Myristoylcarnitine (fat oxidation) |
| Recovery pattern | Rewired, not restored | Reorganised, not recovered |
The simultaneous collapse of both protein and metabolite networks at 35–40 minutes identifies a critical metabolic exhaustion threshold during cardiopulmonary bypass. At reperfusion, the emergence of spondin-1 as a protein hub coincides with the free carnitine spike and fat oxidation restart — suggesting coordinated vascular remodelling and metabolic recovery.
9 Key Findings
- Metabolite co-expression networks undergo a three-phase transformation: stable coordination → progressive breakdown → reorganised recovery
- A metabolic exhaustion threshold at 35–40 minutes of bypass is identifiable from both metabolite and protein network topology
- Reperfusion creates a reorganised rather than recovered metabolic state, with 2.5× more metabolite connections than late ECC
- Three functional metabolic modules emerge at reperfusion: fat oxidation restart, energy cycle recovery, and fuel supply
- Protein and metabolite networks show convergent dynamics, with simultaneous collapse and coordinated hub emergence
10 Next Steps
Joint analysis of proteins and metabolites for integrated multi-omics biomarker discovery is underway, leveraging multi-block data fusion methods (e.g., DIABLO, MOFA+) to identify cross-platform signatures of myocardial injury timing and recovery trajectory.